Inquire: Call 0086-755-23203480, or reach out via the form below/your sales contact to discuss our design, manufacturing, and assembly capabilities.
Quote: Email your PCB files to Sales@pcbsync.com (Preferred for large files) or submit online. We will contact you promptly. Please ensure your email is correct.
Notes: For PCB fabrication, we require PCB design file in Gerber RS-274X format (most preferred), *.PCB/DDB (Protel, inform your program version) format or *.BRD (Eagle) format. For PCB assembly, we require PCB design file in above mentioned format, drilling file and BOM. Click to download BOM template To avoid file missing, please include all files into one folder and compress it into .zip or .rar format.
Arduino Oscilloscope: DIY Signal Visualization for Electronics Debugging
Building an Arduino Oscilloscope transforms a $5 microcontroller into a functional signal visualization tool capable of analyzing waveforms, debugging circuits, and understanding electronic behavior in real-time. While professional oscilloscopes cost hundreds to thousands of dollars, an Arduino-based solution provides essential functionality for hobbyists, students, and makers who need to visualize electrical signals without breaking the bank.
As a PCB engineer who’s designed and debugged countless circuits, I understand the value of oscilloscopes in electronic design. However, I also recognize that not every project justifies a $500+ investment in test equipment. An Arduino Oscilloscope fills the gap between blindly trusting your circuit and investing in professional diagnostic tools. This comprehensive guide covers everything from understanding ADC limitations to optimizing sampling rates and building complete standalone oscilloscope systems.
Understanding Arduino Oscilloscope Capabilities and Limitations
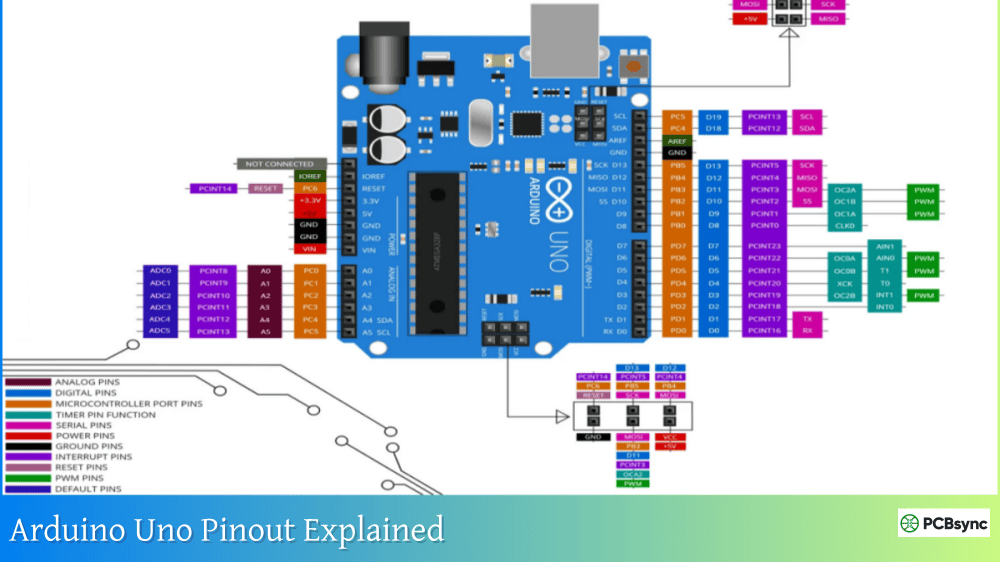
An Arduino Oscilloscope uses the microcontroller’s built-in analog-to-digital converter (ADC) to sample voltage signals and displays the resulting waveforms either on a computer screen via serial communication or on a local display like an OLED or TFT screen. The Arduino Uno and Nano feature a 10-bit ADC, providing 1024 discrete voltage levels across the 0-5V input range, which translates to approximately 4.9mV resolution.
Technical Limitations from an Engineering Perspective
Understanding what an Arduino oscilloscope cannot do is just as important as knowing its capabilities. The primary limitation is sampling rate, which directly determines the maximum frequency you can accurately measure.
ADC Sampling Rate: The Arduino’s standard ADC, when used with the analogRead() function, samples at approximately 9.6 kHz (9,600 samples per second). This might sound adequate, but according to the Nyquist-Shannon sampling theorem, you need at least twice the sampling rate of your highest frequency component to avoid aliasing. This means the basic Arduino setup can only reliably measure signals up to about 4.8 kHz—suitable for audio frequencies but inadequate for most digital electronics.
However, by directly manipulating ADC registers and bypassing Arduino’s libraries, sampling rates can increase dramatically. I’ve personally achieved 77 kHz with optimized code on an Arduino Uno, and some advanced implementations reach 150-200 kHz. This extends the useful bandwidth to approximately 35-75 kHz, which covers basic PWM signals, audio circuits, and slow digital communications.
Resolution Constraints: The 10-bit ADC provides 1024 steps across 5V, yielding 4.9mV resolution. For small signal measurements (millivolt-level audio or sensor signals), this resolution becomes limiting. Additionally, the ADC’s inherent noise (approximately ±2 LSB or ±10mV) further reduces effective resolution to about 8-9 bits in practical applications.
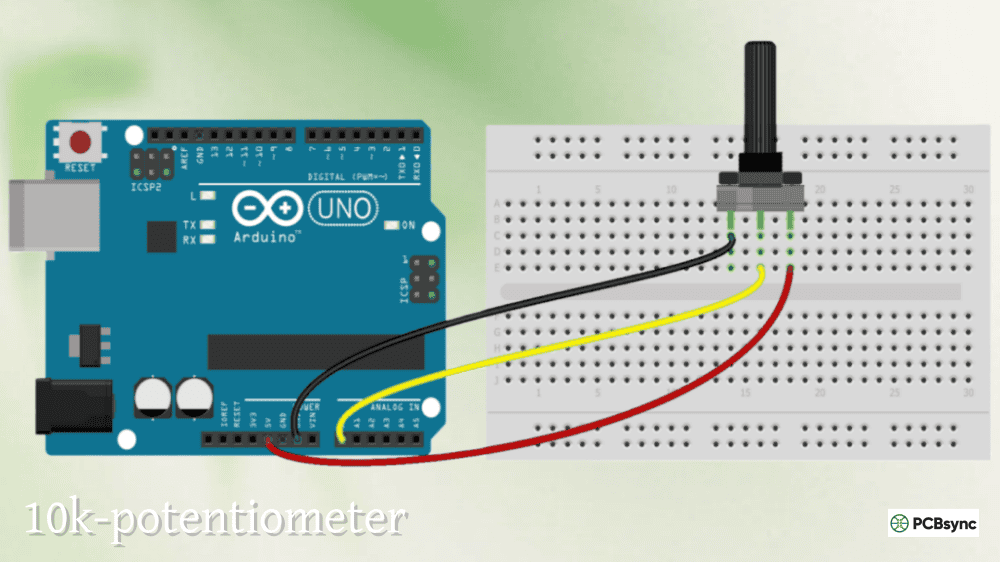
Voltage Range: Arduino ADCs accept 0-5V inputs exclusively. Negative voltages damage the microcontroller, and voltages above 5V can destroy it. This necessitates input protection circuits for AC signals or any voltage sources that might exceed these limits.
Bandwidth vs. Sample Rate: Professional oscilloscopes specify both bandwidth (the frequency range the analog frontend can handle) and sample rate (how fast the ADC samples). In Arduino oscilloscopes, there is no separate analog frontend—the ADC input directly connects to the signal. Therefore, bandwidth and sample rate are intimately linked, with practical bandwidth being approximately 1/4 to 1/3 of the sample rate.
Essential Components for Different Arduino Oscilloscope Configurations
The components you need depend on whether you’re building a PC-based oscilloscope (displaying on computer) or a standalone unit with integrated display.
Component Comparison Table
Component
PC-Based Version
Standalone OLED
Standalone TFT
Advanced Multi-Channel
Arduino Board
Uno/Nano ($3-20)
Nano/Pro Mini ($3-8)
Mega 2560 ($10-20)
Due/Giga ($35-75)
Display
Computer monitor (existing)
0.96″ OLED ($4-6)
2.4″ TFT Shield ($8-15)
3.5″ TFT ($12-20)
Input Protection
Voltage divider + Schottky diode
Same
Same
Op-amp buffer + clamps
Additional Features
Processing software
Pushbuttons for controls
Touch screen controls
Multi-channel, trigger circuit
Total Cost
$5-25
$15-30
$30-50
$75-150
Input Protection Circuit Design
The input protection circuit is absolutely critical—it’s what prevents you from destroying your Arduino while measuring real-world signals. Here’s the design I use for basic protection:
Components Required:
100kΩ resistor (current limiting)
10kΩ resistor (voltage divider)
1N5819 Schottky diode (overvoltage clamping to 5V rail)
1N4148 fast diode (negative voltage clamping to ground)
100nF capacitor (noise filtering)
Circuit Function: The 100kΩ series resistor limits current if the input voltage exceeds safe levels. The voltage divider (if measuring >5V signals) steps down the voltage to safe levels. The Schottky diode clamps positive voltages to approximately 5.3V (5V rail + diode drop), while the 1N4148 clamps negative voltages to approximately -0.7V. The capacitor filters high-frequency noise.
This protection handles transient overvoltages and reasonable input errors but won’t save your Arduino if you directly connect it to 120V AC mains. For measuring AC line voltages, you need isolation transformers and proper high-voltage rated components—beyond the scope of a basic Arduino oscilloscope.
Display Selection and Interface Considerations
PC-Based Display (Recommended for Beginners): Using Processing, Python, or custom serial monitor software, the computer handles all visualization. This approach maximizes Arduino resources for sampling and minimizes code complexity. The display can be large, detailed, and easily modified through software updates.
The primary disadvantage is portability—you need a computer connected via USB, limiting field use. However, for bench testing and learning, this is the ideal configuration.
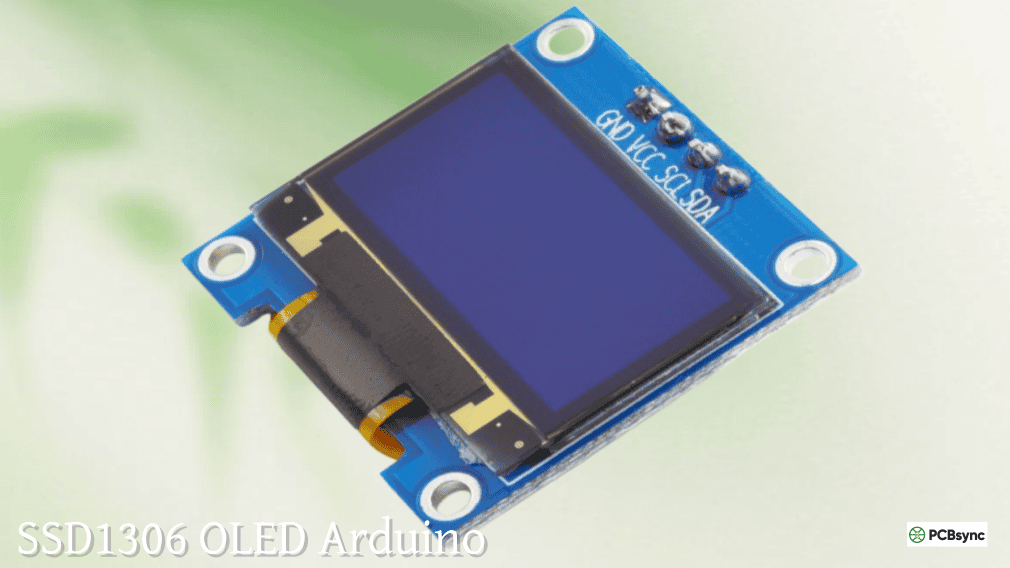
OLED Displays (0.96″ to 1.3″): These I2C or SPI displays provide crisp, high-contrast waveform visualization in a compact package. The 128×64 pixel resolution is sufficient for basic waveform display, though limited screen real estate restricts how much information can be shown simultaneously.
From a technical perspective, I2C OLED displays refresh slowly (approximately 30-60 Hz), creating a tradeoff: fast sampling with slow display updates or slower sampling for responsive display. The solution is buffering—sample at maximum speed, store in array, then display when buffer is full.
TFT LCD Displays (2.4″ to 3.5″): These provide larger, color displays capable of showing multiple channels, grids, and measurements simultaneously. However, they consume significant Arduino resources. Even with optimized libraries, updating a 320×240 TFT display takes 20-50ms, limiting your effective sampling rate during display operations.
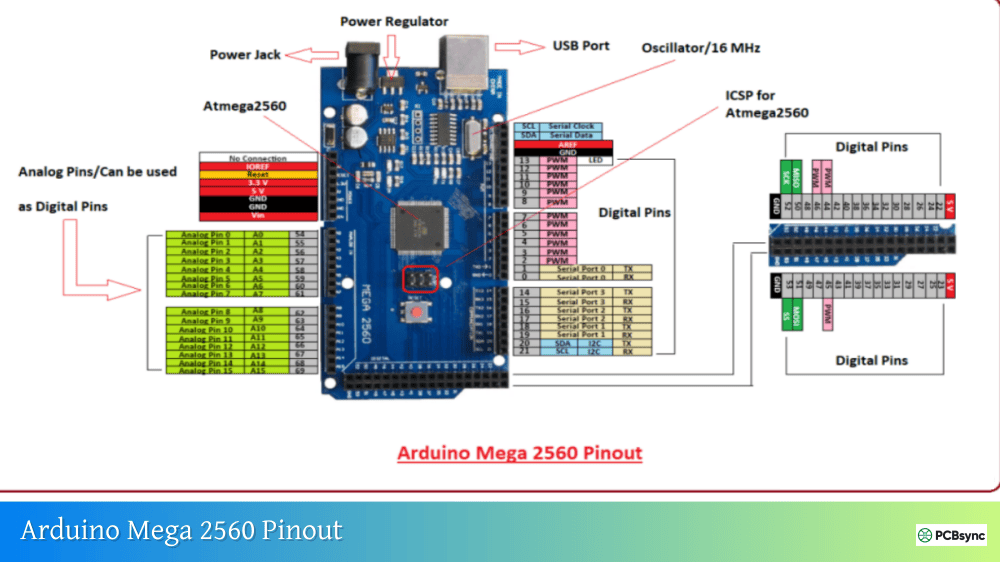
The Arduino Mega 2560’s additional memory (8KB SRAM vs. 2KB on Uno) becomes essential for TFT-based oscilloscopes. You need buffer space for sample storage plus display buffers for the graphics library.
Software Architecture and ADC Optimization
The software determines your Arduino oscilloscope’s performance more than the hardware. Let me walk through the optimization techniques that transform a 9.6 kHz sampler into a 77+ kHz acquisition system.
Understanding ADC Prescaler Settings
The Arduino ADC’s clock frequency is derived from the system clock (16 MHz on Uno/Nano) divided by a prescaler value. The default prescaler is 128, yielding:
ADC Clock = 16 MHz / 128 = 125 kHz
Each ADC conversion requires 13 clock cycles, so:
Sample Rate = 125 kHz / 13 ≈ 9.6 kHz
By changing the prescaler to smaller values, we increase sampling speed:
Prescaler
ADC Clock
Sample Rate
Notes
128 (default)
125 kHz
9.6 kHz
Maximum accuracy, slowest
64
250 kHz
19.2 kHz
Good accuracy/speed balance
32
500 kHz
38.5 kHz
Slight accuracy reduction
16
1 MHz
77 kHz
Noticeable accuracy loss
8
2 MHz
154 kHz
Significant noise, reduced bits
The ADC datasheet specifies optimal operation between 50-200 kHz. Exceeding this reduces effective resolution as the sample-and-hold circuit doesn’t fully settle. In practice, prescaler 32 (38.5 kHz sampling) offers the best speed/accuracy compromise for an Arduino oscilloscope.
Implementing Fast ADC Reading
Here’s the register manipulation code for maximum speed sampling:
void setupFastADC() {
// Set prescaler to 16 for faster conversion
ADCSRA = (ADCSRA & 0xF8) | 0x04;
// Set analog reference to AVCC (5V)
ADMUX = (1 << REFS0);
// Select analog input channel (A0 = 0)
ADMUX = (ADMUX & 0xF0) | 0;
}
inline uint16_t fastAnalogRead() {
// Start conversion
ADCSRA |= (1 << ADSC);
// Wait for conversion to complete
while (ADCSRA & (1 << ADSC));
// Return ADC value
return ADC;
}
This approach achieves approximately 77 kHz sampling on Arduino Uno—8× faster than analogRead().
Efficient Data Buffering Strategies
Sampling generates data faster than most displays can show it. The solution is buffering—capture samples into an array, then process/display the buffer contents.
Circular Buffer Implementation: A circular buffer overwrites old data when full, ensuring the most recent N samples are always available. This prevents memory overflow while maintaining real-time capability.
#define BUFFER_SIZE 256
uint16_t sampleBuffer[BUFFER_SIZE];
uint16_t bufferIndex = 0;
void captureSamples() {
for(int i = 0; i < BUFFER_SIZE; i++) {
sampleBuffer[i] = fastAnalogRead();
// Optional: small delay for specific timebase
}
}
The buffer size depends on available SRAM. Arduino Uno has 2048 bytes, limiting buffers to approximately 1000 samples (2 bytes per uint16_t sample). Arduino Mega’s 8192 bytes permits 4000+ sample buffers.
Physical Layout Considerations: Position the OLED display for clear visibility. Mount input jacks on one side with ground reference clearly marked. Place control buttons where they’re accessible without obscuring the display. If using battery power, include a power switch and LED indicator.
Complete Oscilloscope Code Implementation
The full code implements these features:
Fast ADC sampling with adjustable prescaler
Multiple timebase settings (0.5ms, 1ms, 2ms, 5ms, 10ms per division)
Trigger detection (rising edge, falling edge, or free-run)
Waveform display with voltage grid
Frequency and peak-to-peak voltage measurement
Settings saved to EEPROM
Core Features Breakdown:
Waveform Acquisition: Captures 128 samples per screen refresh. At 77 kHz sampling with maximum speed, this takes approximately 1.7ms—fast enough for smooth display updates.
Frequency Calculation: Counts zero-crossings or peak-to-peak transitions within the buffer and calculates frequency based on sample rate and count. Accuracy depends on having multiple complete waveform cycles within the buffer.
Voltage Measurement: Tracks maximum and minimum ADC values in buffer, converts to voltage (value × 5.0 / 1024), and calculates peak-to-peak amplitude.
Display Rendering: Draws a grid background, plots waveform points connected by lines, and overlays measurement text (frequency, Vpp, timebase setting).
Calibration Procedures
Raw ADC readings require calibration for accurate voltage display:
Zero Offset Calibration: With input grounded, measure the ADC reading. This should be 0, but may show 1-3 due to noise and offset. Record this value and subtract it from all measurements.
Gain Calibration: Apply a known reference voltage (use a precision voltage reference or calibrated power supply). Measure the ADC value and calculate the scaling factor:
Scale Factor = Actual Voltage / (ADC Reading × 5.0 / 1024)
Store this in EEPROM and apply to all voltage calculations.
Timebase Calibration: Generate a known frequency signal (1 kHz square wave from function generator or another Arduino). Verify the displayed frequency matches. If not, adjust the sample delay in your code to compensate.
PC-Based Arduino Oscilloscope with Processing
For maximum flexibility and easiest implementation, PC-based oscilloscopes offer superior performance with minimal Arduino code complexity.
Arduino-Side Implementation
The Arduino code is remarkably simple:
void setup() {
Serial.begin(115200); // High baud rate essential
setupFastADC();
}
void loop() {
uint16_t value = fastAnalogRead();
// Send as two bytes (high byte first)
Serial.write(highByte(value));
Serial.write(lowByte(value));
// Optional: small delay for specific sample rate
delayMicroseconds(10);
}
This continuously samples and streams data to the PC at maximum speed.
Processing Visualization Software
Processing (processing.org) is a Java-based programming environment perfect for creating oscilloscope interfaces:
Key Features to Implement:
Serial port selection and connection management
Real-time waveform plotting with auto-scaling
Trigger level adjustment via mouse or keyboard
Voltage and time cursor measurements
Screenshot/data export capabilities
Pause/resume and single-shot capture
Performance Considerations: Processing can easily handle 50,000+ samples per second with smooth 60 Hz display updates on modern computers. The bottleneck becomes serial communication bandwidth rather than processing power.
At 115200 baud, theoretical maximum is 11,520 bytes per second. With 2 bytes per sample, this limits throughput to 5,760 samples per second. Increasing baud rate to 500,000 or 1,000,000 (if your USB-serial chip supports it) proportionally increases throughput.
Advanced Features and Modifications
Once the basic oscilloscope functions, several enhancements add professional capabilities.
Dual-Channel Implementation
Measuring two signals simultaneously enables comparison, phase relationship analysis, and differential measurements. Implementation requires:
Hardware: Connect two input protection circuits to A0 and A1 Software: Alternate between channels during sampling
for(int i = 0; i < BUFFER_SIZE; i++) {
buffer1[i] = fastAnalogReadChannel(0);
buffer2[i] = fastAnalogReadChannel(1);
}
The drawback: sampling rate for each channel halves since the ADC must switch between inputs. However, for signals under 20 kHz, this remains acceptable.
Display Considerations: Overlay both waveforms in different colors. On monochrome displays, use different line styles (solid vs. dotted) or alternate between channels during successive display updates.
Trigger System Implementation
Triggering stabilizes repetitive waveforms by synchronizing display updates to specific signal conditions.
Trigger Types:
Trigger Mode
Description
Use Case
Free Run
Continuous display without sync
Stable signals, monitoring
Rising Edge
Trigger when signal crosses threshold upward
Digital signals, pulses
Falling Edge
Trigger when signal crosses threshold downward
Negative-going pulses
Level
Trigger at specific voltage
Amplitude-based events
External
Trigger from separate input
Multi-instrument sync
Implementation: Search through incoming samples for the trigger condition. When found, capture the full buffer starting from a pre-trigger offset. This allows viewing the signal before the trigger event.
FFT (Fast Fourier Transform) Spectrum Analysis
Adding FFT converts time-domain waveforms to frequency-domain spectrum displays, revealing harmonic content and frequency components.
Arduino’s limited processing power constrains FFT to small buffer sizes (64-256 points). Libraries like ArduinoFFT handle the mathematics, but expect several milliseconds processing time per FFT operation.
Applications:
Audio spectrum analyzer
Harmonic distortion measurement
Noise frequency identification
Signal characterization
Data Logging to SD Card
Adding an SD card module enables long-term signal recording for later analysis:
Implementation:
Sample at defined intervals (once per second for slow signals, maximum rate for transients)
Write timestamped values to CSV file on SD card
Include trigger events, voltage levels, and metadata
Use circular buffering to capture pre-trigger data
Storage Capacity: A 1GB SD card holds approximately 500 million samples (2 bytes each), equivalent to 6.5 hours at 21 kHz sampling or 27 hours at 5 kHz.
Comparing Arduino Oscilloscope Performance
Let me provide realistic performance expectations based on different Arduino platforms:
Arduino Platform Comparison
Platform
ADC Resolution
Max Sample Rate
Practical Bandwidth
Channels
Cost
Uno/Nano
10-bit
77 kHz
15-25 kHz
1-2
$3-20
Mega 2560
10-bit
77 kHz
15-25 kHz
4-8
$10-20
Due
12-bit
500 kHz
100-150 kHz
2
$35-40
ESP32
12-bit
150 kHz
30-50 kHz
2
$5-10
Arduino Giga
12-bit
10 MHz
2-3 MHz
2
$75-80
Teensy 4.0
10-bit
800 kHz
150-250 kHz
2
$25-30
The Arduino Giga with its STM32H747 processor represents a significant leap in capability, approaching entry-level commercial USB oscilloscope performance. However, for most hobby applications, an Arduino Uno or Nano provides adequate functionality.
Practical Applications and Use Cases
An Arduino oscilloscope excels in specific scenarios where professional equipment is unnecessary or unavailable:
PWM Signal Analysis: Verify PWM frequency, duty cycle, and waveform quality from motor drivers, LED dimmers, or microcontroller outputs. Most Arduino PWM operates at 490 Hz or 980 Hz—well within Arduino oscilloscope bandwidth.
Audio Circuit Development: Debug audio amplifiers, filters, oscillators, and effects circuits. The 20 Hz – 20 kHz audio range falls entirely within capability, though expect limited resolution on very small signals.
Sensor Signal Characterization: Examine analog sensor outputs (temperature, pressure, light) to understand response time, noise levels, and signal characteristics.
Digital Signal Debugging: Verify serial communication (UART, SPI, I2C) signal integrity for slow-to-moderate speed protocols. Baud rates up to 9600-19200 display clearly; 115200 baud is marginal.
Education and Learning: Teaching oscilloscope operation, waveform interpretation, and signal analysis without expensive equipment investment. Students can build their own oscilloscopes as learning projects.
Useful Resources and Downloads
Software Libraries and Tools
Resource
Description
Source
Adafruit_SSD1306
OLED display driver
Arduino Library Manager
Adafruit_GFX
Graphics primitives for displays
Arduino Library Manager
ArduinoFFT
FFT spectrum analysis
github.com/kosme/arduinoFFT
Processing IDE
PC-side visualization software
processing.org
SerialPlot
Real-time data plotting
github.com/hyOzd/serialplot
Xoscillo
PC oscilloscope software
xoscillo.com
Example Code Repositories
GitHub Projects:
arduino-oscilloscope-simple: Basic PC-based oscilloscope with Processing
OLED-Scope: Standalone oscilloscope with SH1106 display
dual-channel-oscilloscope: Two-channel implementation with triggering
arduino-fft-scope: FFT spectrum analyzer using OLED display
oscilloscope-mega: Advanced multi-channel design for Arduino Mega
Hardware Resources
Circuit Designs:
Input protection schematics for various voltage ranges
Probe designs with 10:1 and 100:1 attenuation
Trigger circuit implementations with comparators
Multi-channel input multiplexer designs
PCB Layouts:
Standalone oscilloscope PCB (KiCad format)
Probe interface board
Display shield layouts for Uno and Mega
Learning Resources
Video Tutorials:
“Arduino Oscilloscope from Scratch” by GreatScott!
“DIY Oscilloscope OLED Display” by Circuit Digest
“Fast ADC Techniques” by Electronoobs
“Signal Processing Basics” by Ben Eater
Written Guides:
Arduino ADC datasheet analysis
Oscilloscope specifications explained
Sampling theory for beginners
Trigger system design principles
Troubleshooting Common Problems
No Waveform Display or Flat Line
Symptoms: Display shows no signal variation or remains at zero.
Diagnostic Steps:
Verify input signal is actually connected and within 0-5V range
Test ADC with known signal (connect A0 to 3.3V pin momentarily)
Check Serial Monitor output to verify Arduino is reading and transmitting
Confirm display is properly connected (I2C address, power, ground)
Measure actual voltage at Arduino A0 pin with multimeter
Solutions:
Incorrect wiring: Verify all connections against schematic
Bad input protection circuit: Bypass temporarily for testing (careful!)
Display I2C address wrong: Scan for devices, update code to match
Code not uploading properly: Re-upload, verify board selection
Noisy or Unstable Waveform
Symptoms: Excessive noise, jittery waveform, or random spikes.
Causes and Fixes:
ADC Prescaler Too Fast: Reduce prescaler to 32 or 64 for improved stability
Ground Loop Issues: Ensure common ground between Arduino and signal source
Power Supply Noise: Use filtered 5V supply, add 100μF capacitor near Arduino
Long Input Wires: Shield signal wires or keep under 15cm length
Missing Input Capacitor: Add 100nF capacitor at input protection circuit
Frequency Measurements Incorrect
Problem: Displayed frequency doesn’t match expected or measured value.
Verification:
Test with known frequency source (function generator or second Arduino generating PWM)
Manually count waveform cycles in one displayed division
Calculate expected frequency based on timebase setting
Compare Arduino measurement with commercial oscilloscope or frequency counter
Corrections:
Sampling delay incorrect: Calibrate delay timing with known signal
Frequency calculation algorithm error: Verify zero-crossing counting logic
Sample rate assumption wrong: Measure actual sampling period
Aliasing from undersampling: Reduce input frequency or increase sample rate
Display Update Slow or Frozen
Symptoms: Screen refreshes slowly (<1 Hz) or stops updating entirely.
Causes:
I2C Clock Speed Too Low: Increase I2C frequency: Wire.setClock(400000);
Display Library Inefficient: Try alternate library (U8g2 vs. Adafruit)
Too Much Serial Output: Remove excessive Serial.print() debugging statements
Processing Power Exhausted: Reduce display resolution or sample buffer size
Infinite Loop Blocking: Verify trigger logic doesn’t hang waiting for condition
Frequently Asked Questions
What’s the maximum frequency an Arduino oscilloscope can measure?
The maximum frequency depends on your sampling rate and implementation. A standard Arduino Uno with optimized ADC code achieves approximately 77 kHz sampling, which allows measuring signals up to about 15-25 kHz reliably (following Nyquist theorem with 3-4× oversampling for waveform fidelity). For higher frequencies, use faster platforms like Arduino Due (up to 150 kHz bandwidth), Teensy 4.0 (200+ kHz), or Arduino Giga (2-3 MHz bandwidth). Remember that the stated sample rate needs to be 4-10× higher than your signal frequency for accurate waveform reproduction.
Can I measure AC mains voltage with an Arduino oscilloscope?
No, absolutely not without proper isolation and voltage transformation. Arduino inputs accept only 0-5V DC signals. Connecting AC mains (120V or 240V) directly to an Arduino will instantly destroy the microcontroller and potentially create fire hazards. If you must measure AC mains, use an isolated step-down transformer (120V:6V ratio), followed by rectification and voltage division to bring signals into the 0-5V range. Even then, this requires expert knowledge and proper safety precautions. For AC mains work, invest in a properly rated commercial oscilloscope with differential probes.
How accurate are Arduino oscilloscope voltage measurements?
Arduino oscilloscopes typically achieve 5-10% voltage accuracy, which is adequate for basic signal visualization and fault-finding but not for precision metrology. The primary limitations are the 10-bit ADC (providing only 4.9mV resolution), reference voltage tolerance (built-in reference varies ±10%), and ADC non-linearity (typically ±2 LSB). Commercial oscilloscopes achieve 1-3% accuracy with calibrated 8-bit or 12-bit ADCs, superior analog frontends, and temperature compensation. For improved accuracy, use an external precision voltage reference (like REF02 or TL431) and perform multi-point calibration.
What’s better for an Arduino oscilloscope: PC-based or standalone with display?
This depends on your application requirements. PC-based oscilloscopes (using Processing or Python) offer larger displays, easier software updates, better visualization, and superior data export capabilities. They’re ideal for bench testing where a computer is already present. Standalone oscilloscopes with OLED or TFT displays provide portability, field use capability, and independence from computer requirements. They’re excellent for troubleshooting installed equipment or field service. If you’re learning or developing on a workbench, start with PC-based for simplicity and upgrade to standalone later if needed.
Can I build a dual-channel Arduino oscilloscope?
Yes, dual-channel oscilloscopes are entirely feasible with Arduino. Simply connect two input protection circuits to analog pins A0 and A1, then alternate sampling between channels. The tradeoff is that effective sampling rate for each channel drops by half since the ADC must switch between inputs. An Arduino Uno sampling at 77 kHz becomes a dual-channel oscilloscope with approximately 38.5 kHz per channel, limiting each channel’s bandwidth to about 10-15 kHz. For display, either overlay both waveforms in different colors (on color displays) or use different line patterns on monochrome screens. Arduino Mega with its additional analog inputs can support 4-8 channels, though practical display limitations typically restrict to 2-4 simultaneously visible channels.
Conclusion: Building Your Arduino Oscilloscope Journey
After designing, testing, and refining numerous Arduino oscilloscope implementations, I can confidently say these projects offer exceptional value for learning electronics, debugging circuits, and understanding signal behavior. While they’ll never replace professional-grade equipment for critical measurements or high-frequency work, Arduino oscilloscopes excel at making test equipment accessible to everyone.
The true value extends beyond cost savings. Building your own oscilloscope teaches ADC operation, sampling theory, signal processing, and display interfacing—fundamental concepts applicable across all embedded systems design. The troubleshooting skills you develop diagnosing why your oscilloscope shows noise or measures incorrectly transfer directly to debugging any electronic system.
Start with the simplest PC-based implementation using Processing—you’ll have a functioning oscilloscope in under an hour. Once comfortable, progress to standalone designs with OLED displays, add triggering capability, implement dual channels, or integrate FFT analysis. Each enhancement teaches new concepts while improving functionality.
From a PCB engineer’s perspective, these projects demonstrate that sophisticated test equipment doesn’t require exotic components or massive budgets. An Arduino, some resistors, diodes, and creativity can create genuinely useful instruments. The limitations are real—low bandwidth, modest accuracy, basic features—but for audio work, sensor debugging, PWM analysis, and educational purposes, an Arduino oscilloscope provides 80% of what you need for 5% of the cost.
Build one, experiment with it, understand its limitations, and use it where appropriate. When you outgrow its capabilities, you’ll appreciate commercial oscilloscopes far more for having understood the engineering challenges they overcome. Most importantly, you’ll have created something genuinely useful while learning fundamental electronics along the way.
Inquire: Call 0086-755-23203480, or reach out via the form below/your sales contact to discuss our design, manufacturing, and assembly capabilities.
Quote: Email your PCB files to Sales@pcbsync.com (Preferred for large files) or submit online. We will contact you promptly. Please ensure your email is correct.
Notes: For PCB fabrication, we require PCB design file in Gerber RS-274X format (most preferred), *.PCB/DDB (Protel, inform your program version) format or *.BRD (Eagle) format. For PCB assembly, we require PCB design file in above mentioned format, drilling file and BOM. Click to download BOM template To avoid file missing, please include all files into one folder and compress it into .zip or .rar format.


