Inquire: Call 0086-755-23203480, or reach out via the form below/your sales contact to discuss our design, manufacturing, and assembly capabilities.
Quote: Email your PCB files to Sales@pcbsync.com (Preferred for large files) or submit online. We will contact you promptly. Please ensure your email is correct.
Notes: For PCB fabrication, we require PCB design file in Gerber RS-274X format (most preferred), *.PCB/DDB (Protel, inform your program version) format or *.BRD (Eagle) format. For PCB assembly, we require PCB design file in above mentioned format, drilling file and BOM. Click to download BOM template To avoid file missing, please include all files into one folder and compress it into .zip or .rar format.
Arduino Energy Monitor: Complete Guide to CT Sensor Power Measurement
Building an Arduino energy monitor transforms your understanding of electricity consumption from abstract utility bills to real-time, actionable data. After implementing energy monitoring systems in residential, commercial, and industrial settings, I’ve learned that accurately measuring current and voltage requires understanding both electrical theory and practical sensor interfacing. This comprehensive guide provides PCB-level insights into creating reliable Arduino-based energy monitoring systems.
Understanding Arduino Energy Monitoring Fundamentals
An Arduino energy monitor measures electrical parameters—current, voltage, power, and energy consumption—to provide detailed insights into how electricity flows through your home or facility. Unlike simple power meters that display total consumption, Arduino-based monitors offer customizable logging, real-time analysis, and integration with home automation systems.
The core advantage lies in non-invasive measurement. Current Transformer (CT) sensors clamp around existing wires without requiring electrical work, while voltage monitoring uses standard AC adapters. This safety-first approach makes energy monitoring accessible to hobbyists while maintaining measurement accuracy suitable for professional applications.
How CT Sensors Work
Current Transformers operate on electromagnetic induction principles. When alternating current flows through a conductor (your home wiring), it creates a varying magnetic field. The CT sensor’s ferrite core concentrates this field, inducing a proportional current in the secondary winding. This transforms dangerous high current (10-100A) into safe, measurable low current (typically 50mA).
Key CT Sensor Characteristics:
The transformation ratio defines sensor behavior. A 100A:50mA CT has a 2000:1 ratio—for every 2000A in the primary (your wire), 1A flows in the secondary. Common ratios include 1000:1, 2000:1, and 3000:1. Always verify your CT’s specifications before designing interfacing circuits.
Essential Components for Arduino Energy Monitors
Complete Hardware Requirements
Component
Specification
Purpose
Typical Cost
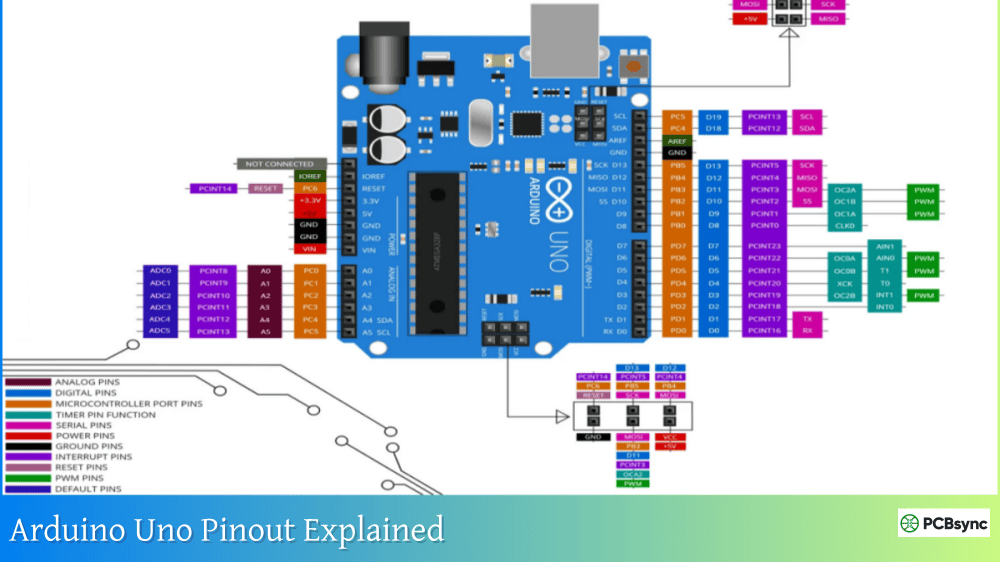
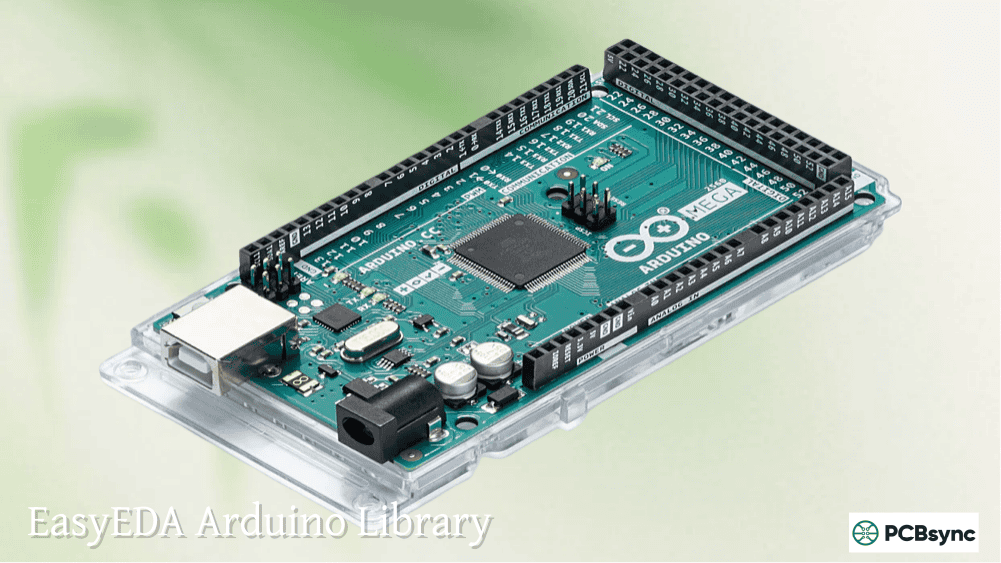
Arduino Board
Uno, Nano, or Mega
Main controller
$3-$25
CT Sensor
SCT-013-000 (100A)
Current measurement
$8-$15
Burden Resistor
18Ω (3.3V) or 33Ω (5V)
Current to voltage conversion
$0.25
Voltage Divider Resistors
2x 10kΩ or 2x 470kΩ
Bias voltage creation
$0.10 each
Smoothing Capacitor
10µF electrolytic
AC signal conditioning
$0.15
AC-AC Adapter (optional)
9V transformer
Voltage measurement
$8-$15
LCD Display (optional)
16×2 or 20×4 I2C
Local readout
$3-$8
WiFi Module (optional)
ESP8266 or ESP32
Cloud connectivity
$3-$10
CT Sensor Selection Guide
Popular CT Sensor Models:
Model
Current Range
Output Type
Built-in Burden
Best Application
SCT-013-000
0-100A
Current output
No
General purpose, requires external burden
SCT-013-010
0-10A
Voltage output (1V)
Yes
Low current circuits
SCT-013-030
0-30A
Voltage output (1V)
Yes
Individual appliances
YHDC SCT-013
0-100A
Current output
No
Whole-house monitoring
From field experience, the SCT-013-000 provides the best flexibility for Arduino projects. The lack of built-in burden resistor allows precise calibration for your specific voltage reference, critical for maximizing analog-to-digital converter (ADC) resolution.
Sizing CT Sensors Properly:
Matching CT current rating to your application prevents accuracy loss. A 100A CT measuring 1A loads operates near its noise floor, producing ±10% errors. For individual circuits drawing 10-20A maximum, use 30A CT sensors. Reserve 100A sensors for main service entrance monitoring where currents reach 50-80A during peak demand.
Burden Resistor Calculation and Design
Understanding Burden Resistors
The burden resistor converts CT secondary current into measurable voltage. This resistor “burdens” the CT with load, hence the name. Proper sizing ensures the output voltage stays within Arduino’s ADC range (0-5V for Uno, 0-3.3V for modern boards) without clipping during maximum current.
Secondary current at 100A = 100A ÷ 2000 = 50mA = 0.05A
Peak secondary current = 0.05A × √2 = 0.0707A
Ideal burden = (5V ÷ 2) ÷ 0.0707A = 35.4Ω
Nearest standard value: 33Ω (always choose lower)
For 3.3V Systems:
Same CT, 3.3V reference:
Ideal burden = (3.3V ÷ 2) ÷ 0.0707A = 23.3Ω
Nearest standard value: 22Ω
Power Rating Considerations
Burden resistors dissipate power as heat. Calculate required wattage:
Power (W) = I²×R
At 100A primary: P = (0.0707A)² × 33Ω = 0.165W
Recommendation: Use 1/4W (0.25W) resistor minimum
For reliability: Use 1/2W (0.5W) or 1W resistor
Professional installations use metal film resistors (1% tolerance) rather than carbon composition for temperature stability and long-term accuracy.
Voltage Biasing Circuit Design
Why Biasing is Required
Arduino analog inputs measure positive voltages only (0V to AREF). CT sensors produce AC output swinging positive and negative around 0V. Without biasing, negative half-cycles clip to 0V, destroying measurement accuracy.
Voltage Divider Biasing:
Two equal resistors create a virtual ground at AREF/2:
R1 (to AREF) —-+—- Arduino Analog Input
|
R2 (to GND) —–+
This mid-rail voltage becomes the zero-current reference point. AC signals from the CT swing equally above and below this bias voltage.
Component Selection:
Resistor Value
Current Draw
ADC Input Impedance Effect
Application
10kΩ + 10kΩ
250µA (5V)
Minimal loading
Mains-powered systems
100kΩ + 100kΩ
25µA (5V)
Negligible
Battery-powered systems
470kΩ + 470kΩ
5.3µA (5V)
Very low power
Ultra low-power operation
Capacitor Coupling:
A 10µF capacitor in parallel with the lower bias resistor provides:
AC path for CT current: Low impedance (~160Ω at 50Hz) bypasses resistor
DC isolation: Prevents bias voltage from affecting CT
AC-AC adapters introduce phase delays between voltage and current measurements, causing power factor errors. The third parameter in emon1.voltage() compensates:
emon1.voltage(0, 234.26, 1.7); // 1.7 is phase shift correction
Typical values: 1.0 to 2.5 (experiment to minimize power factor error on resistive loads)
IoT Integration and Cloud Logging
WiFi Connectivity with ESP8266
Transform standalone monitors into IoT devices for remote monitoring and historical logging.
Hardware Addition:
NodeMCU ESP8266 or ESP32 (replaces Arduino Uno)
Same CT sensor and biasing circuit
Cloud service (ThingSpeak, Blynk, Arduino IoT Cloud)
Create “Thing” with variables: current, voltage, power
Auto-generated code handles WiFi and cloud sync
Build dashboard with gauge, chart, and value widgets
Benefits:
No server management required
Mobile app for remote monitoring
Data history and export (CSV)
Webhook integration for automation
OTA (Over-The-Air) firmware updates
Practical Applications and Use Cases
Whole-House Energy Monitoring
Install CT sensor on main service entrance (typically 100A or 200A breaker). Track total consumption, identify peak usage times, and quantify vampire loads. Many users report 10-15% energy savings simply from increased awareness.
Installation Tips:
Install on hot wire only (not neutral)
Orient CT arrow pointing toward load
Secure with cable tie to prevent sensor drift
Keep sensor 12+ inches from circuit breaker (magnetic field interference)
Solar Production Monitoring
Monitor solar panel output separately from grid consumption. Calculate:
Grid import/export in real-time
Net energy balance
Solar contribution percentage
Return on investment metrics
Dual CT Configuration:
EnergyMonitor emonGrid;
EnergyMonitor emonSolar;
emonGrid.current(1, 111.1); // Main grid CT
emonSolar.current(2, 111.1); // Solar inverter CT
// Net consumption = Grid – Solar
double netPower = gridPower – solarPower;
Appliance-Specific Tracking
Individual circuit monitoring identifies energy hogs:
Appliance
Typical Power
Annual Cost @ $0.12/kWh
Refrigerator
150W continuous
$158
HVAC System
3000W (seasonal)
$720 (4 months)
Water Heater
4500W (2hr/day)
$395
EV Charger
7200W (4hr/day)
$1,263
Monitoring reveals actual vs. rated consumption, enabling cost-benefit analysis for efficiency upgrades.
Troubleshooting Common Issues
Zero or Incorrect Readings
Diagnostic Checklist:
Symptom
Likely Cause
Solution
Constant zero reading
CT not clamped on wire
Verify CT is around single conductor
Reading never changes
CT backwards
Reverse CT orientation
Extremely high readings
Wrong calibration
Recalculate burden resistor value
Noisy/erratic data
Poor grounding
Check all ground connections
Half expected value
Measuring both wires
CT should encompass one wire only
Voltage Measurement at Arduino Pin:
With no load, analog input should read ~512 (mid-scale for 10-bit ADC):
void setup() {
Serial.begin(9600);
}
void loop() {
int reading = analogRead(A1);
Serial.println(reading); // Should be 510-514 with no current
delay(100);
}
Values near 0 or 1023 indicate bias circuit failure.
Power Factor Calculation Errors
Real power factor should be 0.85-1.0 for most household loads. Values outside this range indicate:
Phase shift miscalibration (adjust third voltage parameter)
Insufficient sampling (increase wavelength count in calcVI)
CT sensor saturation (reduce burden resistor)
WiFi Connection Drops
ESP8266 modules are sensitive to power supply quality:
Use dedicated 5V 2A power supply (not USB)
Add 100µF capacitor across VCC/GND pins
Keep WiFi connection code in separate function with timeout handling
Arduino Forum – Energy Monitoring: forum.arduino.cc
EmonCMS Open Source Platform: emoncms.org
Video Tutorials:
“Arduino Energy Monitor Build” by GreatScott!
“OpenEnergyMonitor Setup Guide” by OpenEnergyMonitor
“ESP8266 Energy Monitoring” by Andreas Spiess
Frequently Asked Questions
Can I measure DC current with CT sensors?
No, current transformers only work with alternating current (AC). The transformer principle requires changing magnetic fields, which DC cannot provide. For DC measurement, use hall-effect sensors (ACS712, ACS758) or shunt resistors with differential amplifiers. Hall-effect sensors output voltage proportional to DC or AC current and interface directly with Arduino analog inputs.
How accurate are Arduino energy monitors compared to commercial meters?
With proper calibration, Arduino systems achieve 1-3% accuracy—comparable to consumer-grade commercial monitors. Utility-grade revenue meters reach 0.5% accuracy but cost $200-$500. The primary limitation is CT sensor quality and burden resistor precision. Using 1% tolerance components and careful calibration, Arduino monitors provide sufficient accuracy for home energy analysis, solar monitoring, and non-billing applications.
Can I monitor 3-phase power systems?
Yes, but requires three CT sensors (one per phase) and three Arduino analog inputs. Each phase connects to its own burden resistor and bias circuit. Code modification sums power from all three phases for total consumption. Note that 3-phase calculations require phase angle considerations for accurate power factor—use voltage monitoring on all phases or accept apparent power calculations with assumed power factor.
Is it safe to install CT sensors myself?
CT sensors are inherently safe—they clamp around existing insulated wires without making electrical contact. No wire cutting or electrical connections are required. However, opening electrical panels to access service entrance wiring may violate local codes and void warranties. For main service monitoring, consider hiring a licensed electrician to install the CT while you handle the Arduino side. Individual circuit monitoring at outlets is safe for DIY installation.
How much does it cost to build an Arduino energy monitor?
Basic current-only monitor costs $15-$25: Arduino Nano ($3-5), SCT-013-000 CT ($10-12), resistors/capacitors ($2), breadboard/wires ($3). Adding voltage measurement increases cost to $25-$35 with AC-AC adapter ($8-12). WiFi connectivity adds $5-$10 for ESP8266/ESP32. Complete professional system with enclosure, LCD display, and cloud logging runs $40-$60—still fraction of commercial alternatives ($150-$300) with superior customization and data access.
Conclusion
Building an Arduino energy monitor provides more than just cost savings—it offers deep understanding of how electricity flows through your home or facility. The combination of non-invasive CT sensors, precise analog signal conditioning, and Arduino’s computational power creates a measurement system that rivals commercial offerings at a fraction of the cost.
The journey from raw AC current to meaningful power data teaches valuable lessons about analog circuit design, signal processing, and embedded programming. Understanding burden resistor calculations, voltage biasing, and ADC resolution management develops skills applicable far beyond energy monitoring.
Start with the basic current-only configuration to master CT sensor interfacing and calibration procedures. Once comfortable with these fundamentals, add voltage measurement for true power calculations. When ready for advanced features, integrate WiFi connectivity for remote monitoring and historical analysis.
The OpenEnergyMonitor community continues developing improved hardware designs and software libraries. By building your own system, you join thousands of makers worldwide who’ve transformed their relationship with energy consumption from passive bill-paying to active optimization.
Remember that energy monitoring is just the beginning. The data you collect enables informed decisions about efficiency upgrades, solar installation ROI, and behavioral changes. Many users report that simply seeing real-time consumption creates consciousness that naturally reduces waste.
Whether you’re tracking whole-house consumption, monitoring solar production, or identifying vampire loads, your Arduino energy monitor provides transparency that utility meters cannot match. The investment in building your own system pays dividends through reduced energy costs, improved system understanding, and the satisfaction of creating a tool that works exactly how you want it to.
Inquire: Call 0086-755-23203480, or reach out via the form below/your sales contact to discuss our design, manufacturing, and assembly capabilities.
Quote: Email your PCB files to Sales@pcbsync.com (Preferred for large files) or submit online. We will contact you promptly. Please ensure your email is correct.
Notes: For PCB fabrication, we require PCB design file in Gerber RS-274X format (most preferred), *.PCB/DDB (Protel, inform your program version) format or *.BRD (Eagle) format. For PCB assembly, we require PCB design file in above mentioned format, drilling file and BOM. Click to download BOM template To avoid file missing, please include all files into one folder and compress it into .zip or .rar format.


