Inquire: Call 0086-755-23203480, or reach out via the form below/your sales contact to discuss our design, manufacturing, and assembly capabilities.
Quote: Email your PCB files to Sales@pcbsync.com (Preferred for large files) or submit online. We will contact you promptly. Please ensure your email is correct.
Notes: For PCB fabrication, we require PCB design file in Gerber RS-274X format (most preferred), *.PCB/DDB (Protel, inform your program version) format or *.BRD (Eagle) format. For PCB assembly, we require PCB design file in above mentioned format, drilling file and BOM. Click to download BOM template To avoid file missing, please include all files into one folder and compress it into .zip or .rar format.
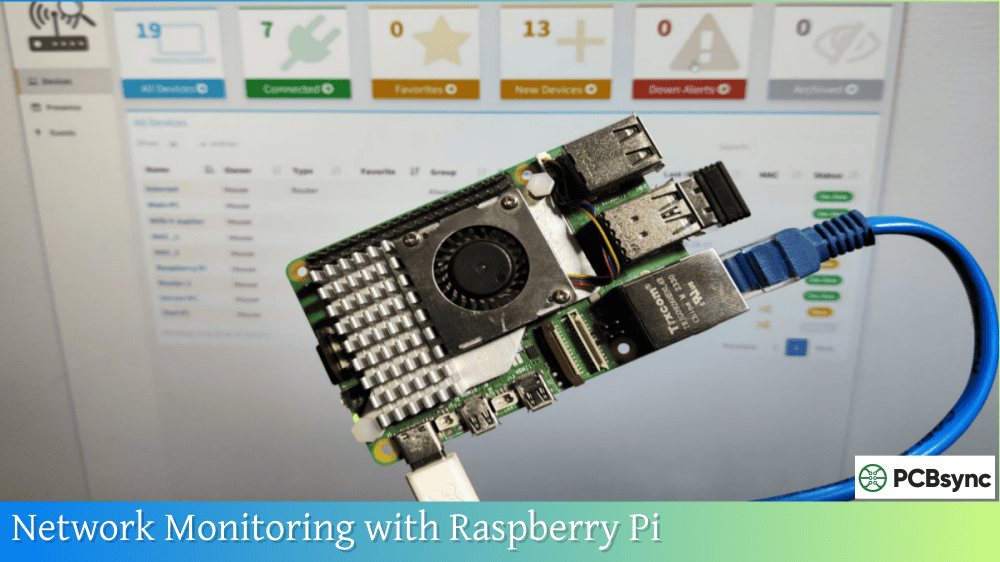
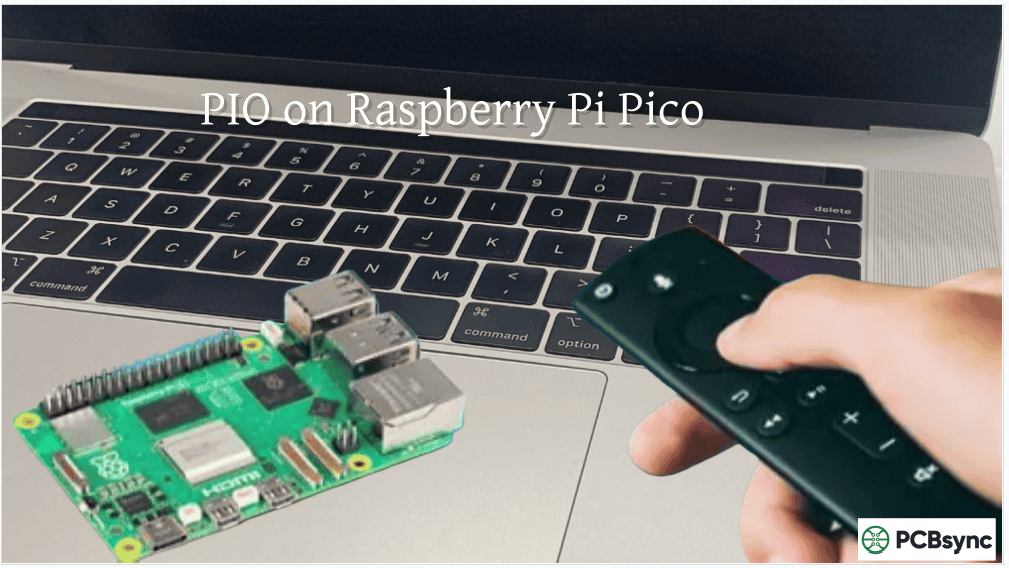
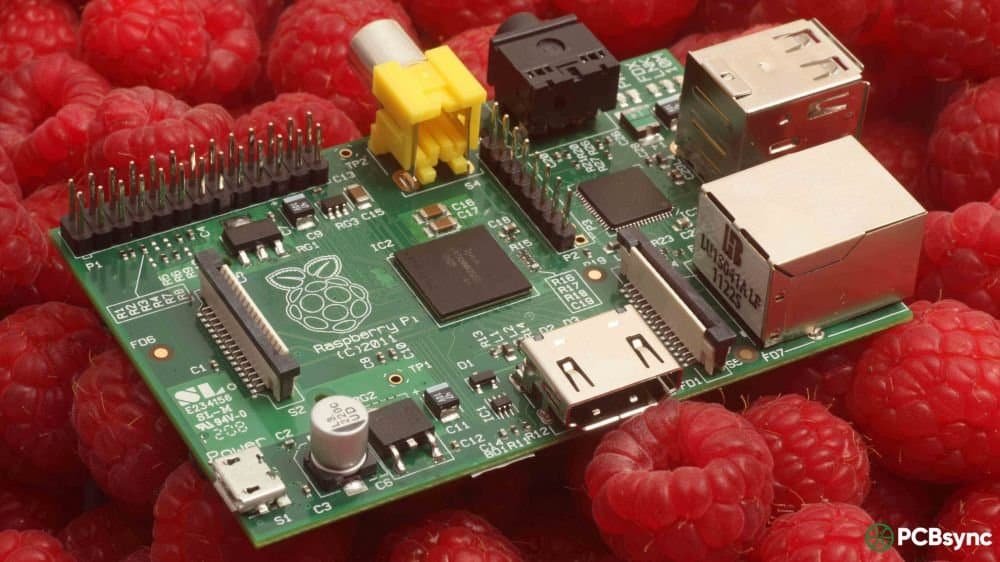
After years of troubleshooting intermittent network issues at home and in small lab environments, I finally built a dedicated monitoring system using a spare Raspberry Pi. The results transformed how I manage my network. Instead of guessing why streaming stutters or why certain devices disconnect, I now see exactly what’s happening across every connection.
Raspberry pi network monitoring isn’t just for enterprise environments anymore. With tools like Prometheus, Grafana, and specialized network analyzers, even a $35 single-board computer can provide professional-grade visibility into your network’s health, performance, and security.
Before diving into specific tools, understanding why the Pi makes such an excellent monitoring platform helps clarify the approach.
Advantages of Raspberry Pi Network Monitoring
Advantage
Description
Low Power Consumption
3-7W typical, runs 24/7 for under $10/year electricity
Silent Operation
No fans in basic configurations
Compact Size
Fits anywhere on your network
Cost Effective
Complete monitoring setup under $100
Always-On Capability
Dedicated device doesn’t compete for resources
Linux Foundation
Access to enterprise-grade monitoring tools
Dual Network Options
Ethernet and WiFi for flexible placement
Recommended Hardware for Monitoring
Component
Minimum
Recommended
Purpose
Raspberry Pi Model
Pi 3B+
Pi 4 (4GB) or Pi 5
Processing and memory
Storage
16GB microSD
32GB+ SSD via USB
Database storage
Power Supply
2.5A
3A official supply
Stability
Network Connection
WiFi
Ethernet
Reliable data collection
Cooling
Passive heatsink
Active cooling case
Long-term reliability
For raspberry pi network monitoring that involves multiple data sources or longer retention periods, the Pi 4 with 4GB RAM and SSD storage provides the best balance of performance and cost.
Understanding the Monitoring Stack
Modern network monitoring typically uses a combination of tools, each handling specific tasks. The most popular stack for Raspberry Pi includes three core components.
The Prometheus and Grafana Stack Explained
Component
Role
Port
Description
Prometheus
Data Collection
9090
Time-series database that scrapes metrics
Node Exporter
Metric Source
9100
Exposes system metrics for Prometheus
Grafana
Visualization
3000
Creates dashboards from collected data
Alertmanager
Notifications
9093
Sends alerts based on defined rules
This stack works through a pull model. Prometheus periodically “scrapes” metrics from exporters running on monitored devices, stores the data in its time-series database, and Grafana queries that database to display visualizations.
Installing Prometheus on Raspberry Pi
Prometheus serves as the foundation of your raspberry pi network monitoring system. It collects, stores, and makes metrics available for querying.
Step 1: Prepare the System
Start with a fresh Raspberry Pi OS installation and update everything:
While Prometheus and Grafana provide excellent metrics collection and visualization, other tools offer different approaches to raspberry pi network monitoring.
Comparison of Monitoring Solutions
Tool
Best For
Complexity
Resource Usage
Prometheus + Grafana
Metrics and visualization
Medium
Moderate
Nagios/NEMS
Service monitoring and alerts
Medium-High
Moderate
ntopng
Real-time traffic analysis
Low
Moderate
Zabbix
Enterprise-style monitoring
High
High
Cacti
SNMP and graphing
Medium
Low
Darkstat
Simple bandwidth monitoring
Very Low
Very Low
Nagios and NEMS Linux
Nagios excels at monitoring service availability and sending alerts when problems occur. NEMS (Nagios Enterprise Monitoring Server) provides a pre-configured Raspberry Pi distribution.
NEMS Feature
Description
Pre-configured
Ready to use after basic setup
Web Interface
Modern dashboard for monitoring
SNMP Support
Monitor network devices
Email Alerts
Notifications when services fail
Check Commands
Ping, HTTP, SSH, and more
Install NEMS by flashing the NEMS Linux image to your SD card and following the initial configuration wizard at https://nems.local/.
ntopng for Traffic Analysis
ntopng provides deep packet inspection and real-time traffic analysis, perfect for understanding bandwidth usage patterns.
Access the interface at https://your-pi-ip:3000 (default: admin/admin).
ntopng Capability
Description
Protocol Analysis
Identify application traffic
Host Discovery
Find all network devices
Flow Analysis
Track connections between hosts
Bandwidth Monitoring
Per-device usage statistics
Alert System
Notifications for anomalies
Zabbix for Comprehensive Monitoring
Zabbix offers enterprise-grade monitoring with extensive features, though it requires more resources than lighter alternatives.
Zabbix Component
Purpose
Zabbix Server
Central monitoring engine
Zabbix Agent
Runs on monitored hosts
Web Frontend
Configuration and visualization
Database
Stores historical data
For smaller networks, Zabbix may be overkill, but it scales well as monitoring needs grow.
Monitoring Network Devices with SNMP
SNMP (Simple Network Management Protocol) enables monitoring of routers, switches, and other network infrastructure.
SNMP Exporter for Prometheus
Install the SNMP exporter to bring network device metrics into Prometheus:
Device Type
Common Metrics
Routers
Interface traffic, CPU, memory
Switches
Port status, VLAN info, errors
Access Points
Client count, signal strength
UPS
Battery status, load percentage
Configuring SNMP on Devices
Most network devices support SNMP v2c or v3. Enable SNMP in your device’s management interface and configure the community string (v2c) or credentials (v3).
Setting Up Alerts and Notifications
Monitoring without alerts means someone must constantly watch dashboards. Configure notifications to receive alerts when problems occur.
Alertmanager Configuration
Create alert rules in Prometheus and route them through Alertmanager:
Alert Type
Condition
Action
High CPU
CPU > 90% for 5 minutes
Email notification
Low Disk Space
Available < 10%
Slack message
Service Down
Target unreachable
PagerDuty alert
High Network Usage
Bandwidth > 90% sustained
Dashboard annotation
Notification Channels
Channel
Use Case
Configuration
Email
Non-urgent alerts
SMTP settings
Slack
Team notifications
Webhook URL
PagerDuty
Critical alerts
Integration key
Telegram
Personal alerts
Bot token
Webhook
Custom integrations
Endpoint URL
Useful Resources
Resource
URL
Description
Prometheus Downloads
prometheus.io/download
Official binaries
Grafana Downloads
grafana.com/grafana/download
ARM packages
Node Exporter Releases
github.com/prometheus/node_exporter
Latest versions
Grafana Dashboards
grafana.com/grafana/dashboards
Community dashboards
NEMS Linux
nemslinux.com
Pre-built Nagios for Pi
ntopng Packages
packages.ntop.org/RaspberryPI
Traffic analyzer
Zabbix Documentation
zabbix.com/documentation
Setup guides
PromQL Examples
prometheus.io/docs/prometheus/latest/querying
Query language
Optimizing Performance on Raspberry Pi
Running monitoring tools on limited hardware requires optimization to maintain responsiveness.
Performance Tuning Tips
Optimization
Implementation
Impact
Increase scrape interval
Set to 30-60 seconds
Reduced CPU/storage
Limit retention
7-15 days typical
Reduced storage
Use SSD storage
USB 3.0 SSD adapter
Faster queries
Filter metrics
Drop unused metrics
Reduced storage
Reduce dashboard refresh
30-60 second intervals
Lower CPU usage
Storage Considerations
Storage Type
Read Speed
Durability
Recommendation
microSD
90 MB/s
Low (writes)
Short-term only
USB SSD
400+ MB/s
High
Best for monitoring
NVMe (Pi 5)
800+ MB/s
High
Premium option
Frequently Asked Questions
How much storage does Prometheus need on a Raspberry Pi?
Storage requirements depend on the number of metrics collected and retention period. A typical home network monitoring setup with 5-10 devices generates approximately 500MB-1GB per week. With default 15-day retention, plan for 2-3GB for Prometheus data alone. Using an SSD instead of microSD significantly improves both performance and reliability for database workloads.
Can a Raspberry Pi handle monitoring a large network?
A Raspberry Pi 4 with 4GB RAM comfortably monitors 20-30 devices with standard metrics collection. For larger networks exceeding 50 devices or requiring sub-second scrape intervals, consider distributing the load across multiple Pis or upgrading to more powerful hardware. The limiting factor is typically storage I/O rather than CPU or memory.
What’s the difference between Prometheus and Nagios for network monitoring?
Prometheus excels at collecting and storing time-series metrics, making it ideal for performance monitoring, capacity planning, and trend analysis. Nagios focuses on service availability and state monitoring, answering “is this service up or down?” Use Prometheus when you need detailed metrics and beautiful dashboards through Grafana. Choose Nagios when you primarily need availability monitoring and alerting with less emphasis on historical data visualization.
Can I monitor Windows computers with this Raspberry Pi setup?
Yes. Install the Windows Exporter (formerly WMI Exporter) on Windows machines to expose metrics in Prometheus format. Add the Windows machine as a target in your Prometheus configuration, and the Pi will scrape metrics just like from Linux hosts. Grafana dashboard ID 14694 provides a comprehensive Windows monitoring view.
How do I monitor my router and switches with a Raspberry Pi?
Most network devices support SNMP (Simple Network Management Protocol). Enable SNMP on your devices, then install the SNMP Exporter on your Pi. Configure the exporter with your device’s SNMP community string and add targets to Prometheus. This allows monitoring of interface traffic, CPU usage, memory, and device-specific metrics. For devices without SNMP, tools like ntopng can analyze traffic patterns by monitoring network flows.
Building Your Complete Monitoring Solution
Effective raspberry pi network monitoring combines multiple approaches. Start with Prometheus and Grafana for metrics collection and visualization, add Node Exporter to every device you want to monitor, and configure alerts through Alertmanager to receive notifications when problems occur.
For deeper network visibility, supplement with ntopng for traffic analysis or NEMS for traditional availability monitoring. The modular nature of these tools allows starting simple and expanding as your monitoring needs grow.
The investment of a few hours setting up proper monitoring pays dividends in reduced troubleshooting time, better network understanding, and early detection of issues before they become critical problems. With a Raspberry Pi handling the monitoring duties, you get enterprise-grade visibility at hobbyist prices.
Suggested Meta Descriptions:
Option 1 (154 characters): Build a raspberry pi network monitoring system with Prometheus, Grafana, and more. Complete setup guide with installation steps, dashboards, and alerts.
Option 2 (152 characters): Transform your Raspberry Pi into a network monitoring powerhouse. Learn to install Prometheus, Grafana, Nagios, and ntopng for complete network visibility.
Inquire: Call 0086-755-23203480, or reach out via the form below/your sales contact to discuss our design, manufacturing, and assembly capabilities.
Quote: Email your PCB files to Sales@pcbsync.com (Preferred for large files) or submit online. We will contact you promptly. Please ensure your email is correct.
Notes: For PCB fabrication, we require PCB design file in Gerber RS-274X format (most preferred), *.PCB/DDB (Protel, inform your program version) format or *.BRD (Eagle) format. For PCB assembly, we require PCB design file in above mentioned format, drilling file and BOM. Click to download BOM template To avoid file missing, please include all files into one folder and compress it into .zip or .rar format.


